Showing posts with label navigation. Show all posts

Wednesday, 1 June 2022

It can happen to anyone...

MV Northern Lights (Seattle Yacht Club) on the rocks at Pruth Bay.

The rocks she hit are large and very clearly marked on the chart. 

Rocks are circled in red


A moment's lapse of attention and there goes the day. Fortunately, boat
floated off at high tide, and headed to Shearwater to be hauled out and
damage inspected.

It can happen to anyone. We've hit rocks, but never stayed on them like
this this poor fellow (well, I doubt he is "poor").

Always taught us a lesson though.


Saturday, 26 March 2022

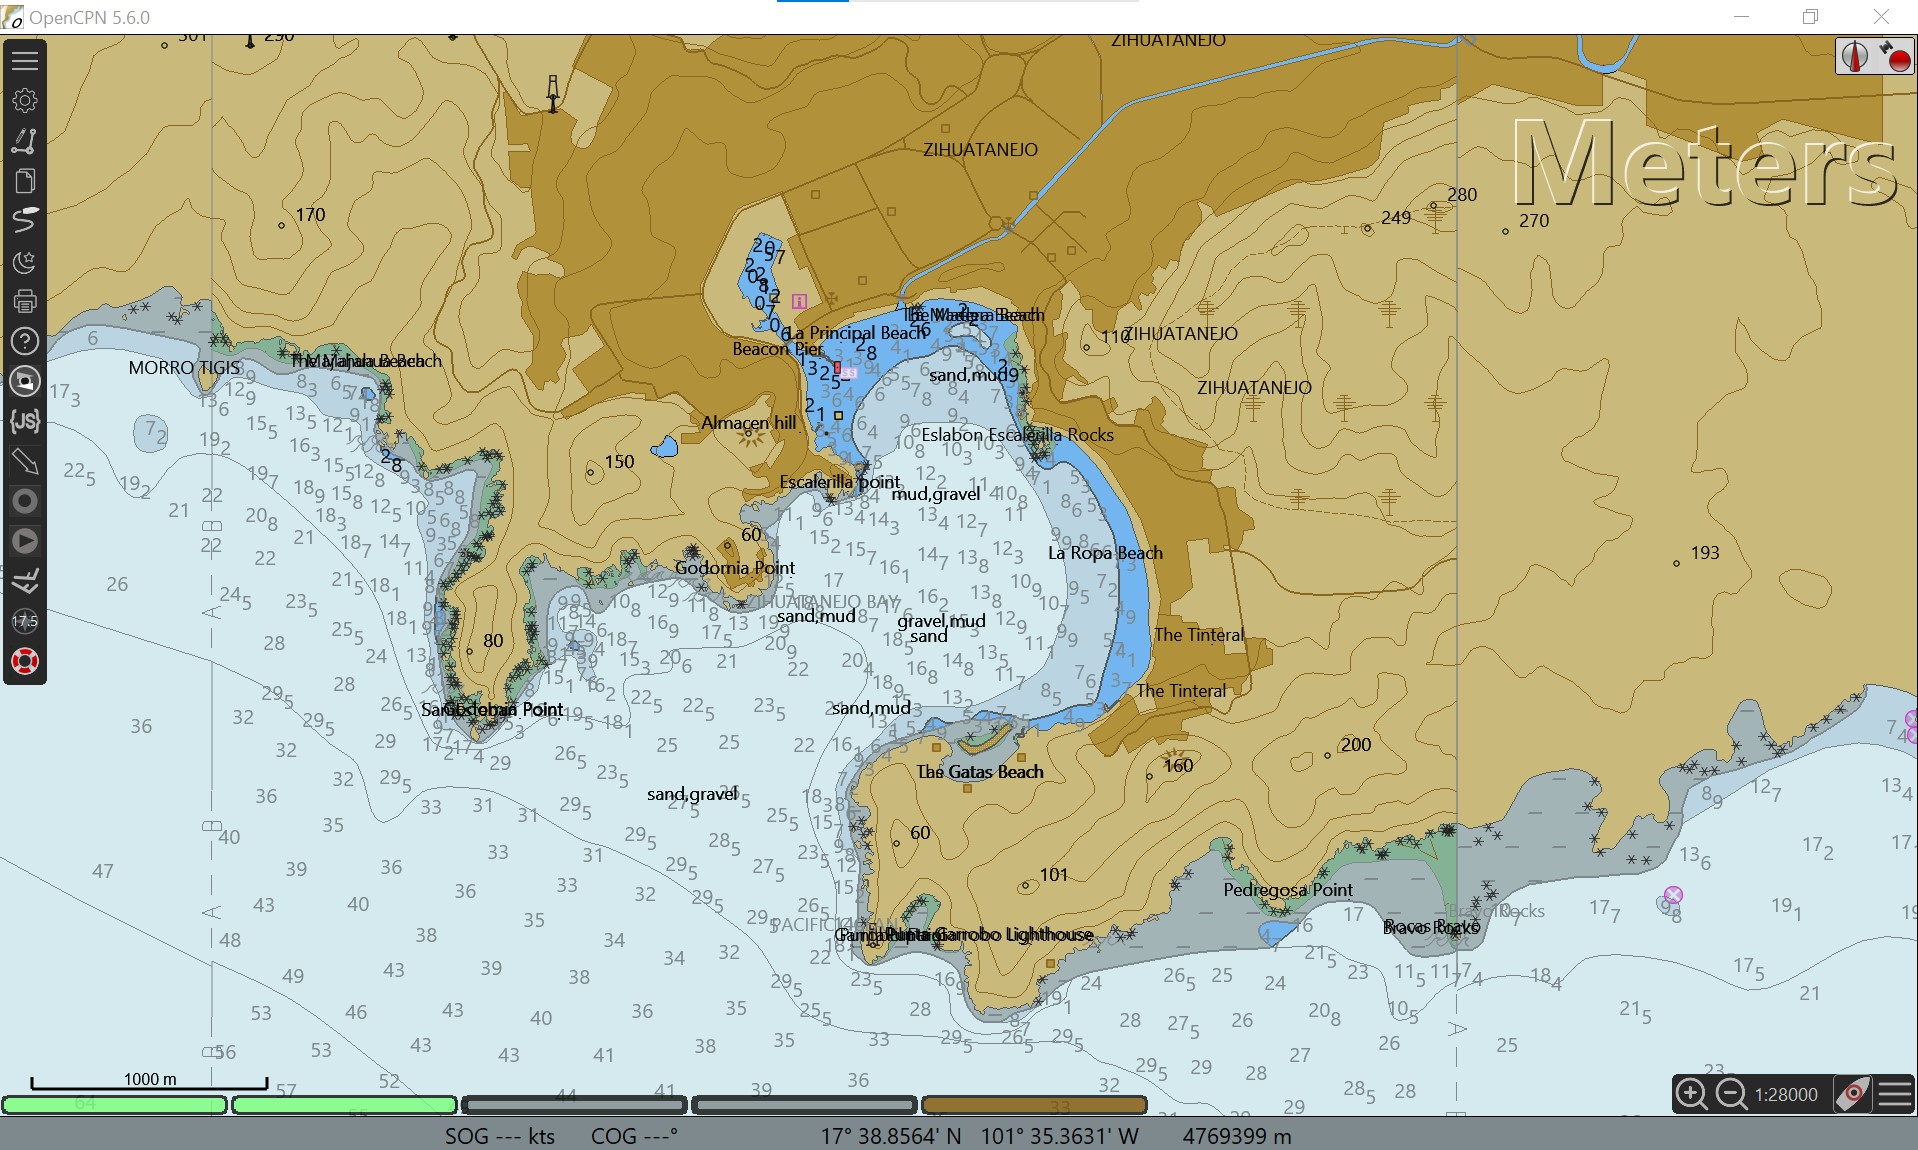
The best chart package combination for Pacific Mexico: OpenCPN and O-CHARTS

Zihuatanejo harbour (O-Charts & OpenCPN)


Best charting package: OpenCPN

(when combined with charts available for OpenCPN)

I have long touted OpenCPN. It is the most (or among the most) full-featured charting packages. It is continuously being updated/upgraded with new features, and support easily obtained.

My favourite OpenCPN features:

  • Accepts most chart types: Raster [BSB/KAP (such as CHS and NOAA raster files), mbtiles; Vector (S57 ENC (such as free NOAA files), some S63, CM93v2, and  O-SENC]
  • Excellent waypoint creation and management
  • Excellent route creation and management
  • Presentation of AIS target information 
  • VDR (Voyage Data recorder): Save depth, AIS, etc data for later re-playing (and creation of depth surveys) 
  • and much more!

This open-source charting package is available free for PC, MAC and Linux, and for a very small one-time fee for Android. (Due to Apple's iOS licensing issues, OpenCPN is not available for iPhone or iPad.)


Best source of charts for Mexico's Pacific Coast: O-Charts

I've recently had the opportunity to review the O-Charts (Open Charts) Mexico charts. I've focused on the Pacific coast.


(1) O-Charts' SEMAR charts:

A new addition, O-Charts now offers official Mexico charts from Mexico's SEMAR. Charts are in two sets, one for Mexico's Pacific coast and the other for Mexico's Gulf of Mexico coast. Each chart set is offered for a very reasonable price (26 to 30 euros/set), which includes free updates for 1 year (update frequency is reported to be weekly). Most of these charts are fairly recently issued and/or have received recent updates. They are not old charts "from the 1800s" so often alluded to by misinformed cruisers.

SEMAR (O-Charts): Entrance to Sabalo (Mazatlan)

SEMAR (O-Charts): Sabalo (Marina Mazatlan)

Pacific Mexico: The O-Charts' SEMAR packages are from SEMAR's ENC (vector) charts. NOTE: Although extensive, the SEMAR ENC collection is missing several charts from their RASTER collection. This means a few key locations for cruisers are missing from O-Charts' SEMAR package. With two exceptions (see below), these few locations on raster charts missing from SEMAR ENC are all easily replaced by also purchasing Blue Latitude raster charts from O-Charts.

Commercial chart sources, such as Navionics and C-MAP, all obtain their Mexico chart information from SEMAR. Sometimes these commercial charts include data from both vector and raster from SEMAR are included, other times only vector. 

However, it is important to note that SEMAR data (and thus Navionics/C-MAP) usually does not cover popular small-boat anchorages. 

The solution is to add Blue Latitude charts, as shown in the following example for Isla San Francisco, below:


Navionics: no data for Isla San Francisco

SEMAR (O-Charts): no data for Isla San Francisco

Blue Latitude (O-Charts): Detailed Isla San Francisco
Blue Latitude (O-Charts): Detailed chart for Isla San Francisco (from guidebook)


(2) O-Charts' Blue Latitude charts: 

O-Charts has for some time offered the two Blue Latitude chart sets for the Sea of Cortez and Pacific Mexico (36 euros per set). These chartlets, found also in the excellent Blue Latitude guidebooks, provide GPS-accurate charts for all the main harbours and hundreds of small-boat anchorages on Mexico's Pacific coast (excluding the west coast of the Baja peninsula). NO other charts provide such detail.  

These charts are essential for west coast cruisers.  


For cruisers, the combination of SEMAR and Blue Latitude charts, both available from O-Charts, provide excellent coverage of Mexico's Pacific coast.


The two important exceptions:

O-Charts SEMAR Pacific chart set is missing detailed charts for two key locations for cruisers on the west coast of Baja: Turtle Bay and Bahia Santa Maria/Bahia Magdalena. Unfortunately, these locations are not part of the Blue Latitude chart sets, as they do not cover Baja's west coast. 


There are easy solutions for charts for these two Baja locations:

  • Most up-to-date chart cards for chartplotters (Navionics, C-MAP) will have detailed charts for these two Baja locations (derived from SEMAR's detailed raster charts)*
  • Navionics and C-MAP iOS/Android apps also contain detailed charts*


* Note: Navionics/C-MAP do not provide more detailed charts (compared to O-Charts' SEMAR) for other areas of the west coast of Baja. For the many poorly charted locations on Baja's west coast, I recommend making detailed satellite images (mbtiles are best) using SASPLANET/SAT2CHART and OpenCPN.

Monday, 7 June 2021

"UPDATED" NAVIONICS AND C-MAP CHARTS ARE OFTEN NOT "UP-TO-DATE" (Canada)

UPDATES (Sept 25, 2021): I have reached the conclusion that you cannot depend upon Navionics (or CMAP) charts to be "up-to-date" within a reasonable time. I find too many incidences of CHS chart updates (for new rocks, shallows, etc) that are not shown on Navionics, even several months later.  

In my view, relying solely/primarily on Navionics charts is not safe.

June 3, 2023: (i) There is new (May, 2023) CHS detailed charting for Tasu Sound (Haida Gwaii) on vector charts. Navionics does not yet include this new charting. Stay tuned! (ii) The new rock and sunken wreck in Thetis Island's North Cove charted by CHS in the Fall of 2021 are still not indicated on Navionics, 1.5 years later! 

December 2023: More than TWO YEARS LATER, Navionics finally includes Thetis Island North Cove updates  ALSO: Navionics now includes new Haida Gwaii charts (5 mos later...). 

February 2024: C-MAP finally includes the new (May/June 2023) Haida Gwaii Charts.


You may think (hope) that your just "updated" Navionics or C-MAP charts  are now "up-to-date". This is not necessarily the case (applies to both app and card-based updates).

Recently, checking "Notices to Mariners" (NOTMAR: https://www.notmar.gc.ca/monthly-mensuel-en.php) by Canadian Hydrographic Services (CHS), I noticed the February version indicated newly discovered rocks/shallows in the general area near Discovery Islands and Desolation Sound.

Below are images from official CHS Raster charts from May 2020 and June 2021:

The updated CHS charts (June, 2021) show the two new drying rocks in Manson Passage (top, right) and the 0.3m shallows in Plunger Pass (bottom, right). Both are dangerous to most boats (especially the shallow area in Plunger Pass, which we passed through last summer).


What about Navionics and C-MAP? As of June 7, 2021, neither show these updates. This includes the C-MAP App and C-Map SD card (card purchased in May, 2021) as well as the Navionics App (as well as the online viewer).

Manson Passage: Navionics (June, 2021, not accurate)

 
Plunger Passage: Navionics (June, 2021, not accurate)


Manson Passage: C-MAP (June, 2021, not accurate)

Plunger Passage: C-MAP (June, 2021, not accurate)

At least 3 months after CHS issued a NOTMAR about these rocks/shallows, yet they are still not shown on "updated" Navionics or C-MAP charts.


Update (August, 2021): Navionics finally updated the above locations by August 14th, 2021. By December 2021, C-MAP updated these locations.


HOWEVER:

The September CHS NOTMAR had new shallows, rocks and wrecks. For example: Here's another  "new" rock and a wreck (North Cove, Thetis Island) shown on the up-to-date CHS raster chart, but not (yet, as of November 20)) on the just-updated Navionics or CMAP:


Keep an eye out to see how long it takes Navionics (or CMAP) to include these updates! 

November 20, 2021: neither Navionics or CMAP have included this September update.)

January 2022: Navionics still doesn't include this update, whereas CMAP does. 

June 2023: Navionics STILL DOES NOT INCLUDE THESE HAZARDS (1.5 years after they were updated by CHS!)


IN CONTRAST, O-CHARTS SEEM TO QUICKLY UPDATE:

O-Charts (https://www.o-charts.org/) makes CHS ENC Vector charts available for OpenCPN  at a very reasonable annual price (20 Euros for Pacific Coast of Canada). These charts can be updated monthly, and are supposed to be the same as CHS ENC charts. 

(OpenCPN is an excellent free/near-free chartplotter software for Windows, Mac, Linux and Android.)


By March, 2021, the O-Charts for Manson and Plunger Passages included the February update:

Manson Passage: O-Charts (March, 2021 -- accurate!)

Plunger Passage: O-Charts (March, 2021 -- accurate!)


Update: just checked earlier NOTMAR editions: current Navionics and C-MAP missing more rocks/shallows in other areas of BC! (O-charts, however, are correctly updated.)


CONCLUSION: Commercial charts such as Navionics or C-MAP may NOT be up-to-date (even though you just "updated" them). "New" rocks and shallows shown on up-to-date official charts may be missing on Navionics and/or C-MAP!


On Pelagia, we ensure our CHS charts are up-to-date. Though we also have Navionics and C-MAP, we but put much greater trust on the CHS raster charts (we are still getting used to the O-charts -- so far, so good.)


Monday, 8 March 2021

Saving depths as you go...


 UPDATE, March 26, 2024: revised version (adds UTC time to output; minor fixes) uploaded [NMEAtoXYZ-3c]


This post is part of a series concerning obtaining/creating more-detailed depth information.

Note: this particular post is technical and may not be of interest to some....


Entering an unfamiliar (and poorly charted*) bay, it would be nice to have a record of depths as we explore. In such cases, however, one must focus on safely navigating, rather than noting down or saving depths.

* In B.C., many bays and coves on up-to-date, decently charted areas often have only a few soundings.


OpenCPN Voyage Data Recorder

Our GPS, AIS, and depth/wind/speed information are now available via WIFI for use by our ship's computer and Android tablet running OpenCPN chartplotting software. OpenCPN is fantastic. Among its many free plugins is the "Voyage Data Recorder", or VDR. When VDR is set to "record", it saves all the NMEA sentence information (including AIS, latitude, longitude, depth, etc) into a text file, until the recording is stopped. A short example of a NMEA text file is shown below:

Sample section of a NMEA text file

In the above sample, !AIVDMs are NMEA sentences for AIS info, $IIDPTs are depths, $IIMWVs are wind, $GPVTGs are speed and course over ground, and $GPRMC, $GPGGA, $GPGLL sentences provide GPS location (Lat/Lon), time, date, course and other GPS information.

The depth information in a NMEA text file does not contain location (Lat/Lon) info. However, there is always such information within less than a second of the depth sentence. We have written a short program to associate NMEA depth info with location, and to save these depth points into two types of files. NMEAtoXYZ is a simple program for Windows PCs that inputs a NMEA text file, and outputs (i) a GPX file of depth waypoints, and (ii) an XYZ file of the same points.  The program gives the user the option to correct depths for tide level (recommended), and to determine the spacing (in time, thus distance) between depths. #

A GPX file can be imported into any GPS or chartplotter. The XYZ file can be used by software to produce satellite image chartfiles WITH depths plotted (see below).


The following screenshots show the process and output:

Playback of VDR recording in English Bay. Pelagia is shown as the red boat with a red trail. [The green triangles represent AIS broadcasted from anchored (black dot) and moving (with line of projected course in front) ships.]


Zoom in on Pelagia (with Tug & Tow heading in opposite direction)


NMEAtoXYZ-3a: GPX output

Depth waypoints (S2Z22 highlighted) saved to GPX by NMEAtoXYZ program


Waypoints are coded in two ways: Arrow symbol and 1st two characters of waypoint name

S2xxxx: Magenta arrow: Depth >20m

S1xxxx: Blue arrow: Depth >2m to 20m

S0xxxx: Red arrow: Depth ≤2M

The symbols are specific to OpenCPN; the waypoint name will work with all GPSs and chartplotters


NMEAtoXYZ-3a: XYZ output

Using SASPLANET and SAT2CHART programs, the XYZ file's depths may be plotted on to a satellite image of the area. This image may then be displayed as a "chart" on OpenCPN. (Full details are explained in SAT2CHART's HELP pages.)

Satellite image chart with depths

The number of depths points plotted by SAT2CHART depend on the zoom factor (higher zooms = more points, when available)


One may also plot these depths on (i) an image of a Navionics chart (using SASPLANET & SAT2CHART) or (ii) on an existing raster chart using a GIS program such as QGIS.


Depths plotted on CHS chart (using QGIS)

The above examples are from Vancouver Harbour. Obviously, such a well-charted place does not require one to be saving depths and making image charts with depths are not required (it's just a test example).

However...

British Columbia still has some areas where nautical charts contain NO depth soundings (for example, parts of the West coast of Haida Gwaii). Even more common, many bays and coves in BC, even in Southern BC, have very limited depth details. A good example is the entrance to Von Donop Inlet/Ha'thayim Marine Park, which we described in a recent post. 

As we cruise this coming Summer, we hope to obtain more-detailed depth information for the places we visit using (i) the VDR feature of OpenCPN and the above programs, as well as (ii) more-detailed scans using our Deeper Pro+ portable sounder.


The NMEAtoXYZ program (with helpfile) is available free to download from the following link (USE AT YOUR OWN RISK!):

Download latest program update from this link:

https://drive.google.com/file/d/1-YGVXu7k-fYrXD9hWwD5g1E3f5U3m2q8/view?usp=sharing                                      

Note, it has only been tested on a PC running Windows (it MAY work on Linux and MacOS, but these have not been tested).  It is a very simple program (written using QB64), currently with no GUI.  NMEA VDR file plugin and OpenCPN are available for most platforms, except those running iOS. 


# FYI: Reefmaster is commercial software (US$200) that also will save depths with lat/lon, plus a lot more.

Sunday, 16 August 2020

That ROCK in the entrance to HA'THAYIM (VON DONOP) MARINE PARK... Detailed info (UPDATED!)

Depths (in feet, uncorrected for tide)

UPDATE May 17, 2021: CHS "nonnavigational" soundings ("NONNA10") indicate the depth over "the rock" is 0.6m at zero tide. ALSO, the rock immediately north has a least depth of 1.8m. This too would be an issue for boats with a 6' draft (e.g., Pelagia). Text below has been revised.

**Take home: Subtract 0.5m (1.64') from soundings to be safe(r)**

Updated March 14, 2021:

Von Donop Inlet (properly known as Ha'thayim Marine Park) is a favourite anchorage of ours in the Desolation Sound/Discovery Islands area, situated at the northern end of Cortes Island.

As every decent cruising guidebook notes, the narrow entrance has a rock approximately mid channel; the exact depth of this "rock" is not well documented (the official chart shows a "+", indicating a rock "with less than 6 feet over it a zero tide"). Usual navigation instructions are to "hug the western shore". How close to this shore, however, is an issue, as at some tide levels, depths are also too shallow if one hugs the shore a little too closely!

Every year, sailboats hit this rock. Fortunately, we have not, but we know some who have. 

The official CHS chart is not very highly detailed (commercial charts, such as Navionics, derive their data from the CHS chart). We do not depend on the chart for the rock's location, as we have found the "+" symbol to be only approximately correct. Instead, in the past we hugged the western shore when we were passing the "second yellow bare patch on the eastern shore". It always worked for us, but was never a very satisfactory method as (i) hugging the western shore had depths going very low, and (ii) it doesn't really let us know where the rock is located.

This year, David used his new Deeper Pro+ portable sonar to do a detailed scan of the entrance channel (at higher tide) in order to finally figure out this rock.

What we learned:

  • the "rock" is actually a pretty wide rock, least depth of about 1.0 m (3.28') 0.6m (1.9') at zero tide, covering 2/3rd of the width of the channel. A serious issue for most sailboats, and some powerboats
  • there is, indeed, a deep (enough) channel to the west of this rock
  • there is another rock immediately northwest of the rock with a least depth of about 1.9 m (~6.2':  1.85m (~6.06'): so only a worry for boats with keels 6 over feet)
  • further north, there is a very shallow area on the west shore jutting out a little, north of these rocks. Hugging the west shore therefore not a good idea at the northern entrance to the narrow section 
  • do not consider going to the east of the rock (i.e., don't go along the eastern shore)


The following figures provide more detailed information:


Uncorrected depths in ft: the arrow points to place of 1m 0.6m corrected depth (sorry, not "3.8ft")


The Deeper Pro+ sonar app creates a bathymetric map as you scan. The above map was created from many passes up/down/across the narrow section. These passes did not include all of the area within the map (see figures below); the Deeper app interpolates/extrapolates from the data to "fill in" the map. (Thus, if I missed a shallow area, the map too may miss this.) I thus tried to concentrate my scans around the rock/shallow areas to improve accuracy.


Unfortunately, the Deeper app does not provide for a correction for tide level -- seems it only understands "lakes" -- so the depths in this map reflect the higher tide level at which I scanned; they must be corrected for tide level (thus, the "8.2 feet" above is actually <4 feet at low tide).

Some extra detail (sorry... ): If one uploads the Deeper Pro+ scan data to the Deeper cloud on the internet (each Deeper owner gets an account), one can login into their account on the Deeper Lakebook page (maps.fishdeeper.com) and view more detailed data, including the actual depth readings. One can also download all the depth recordings, their latitude/longitude. and time as a CSV text file. Of course, none of these depths are corrected for tide level.

[As much as I like the Deeper system, requiring one to have good internet access in order to get the accurate location information -- i.e., the lat/long -- is a serious flaw and ridiculous. Most of British Columbia's coastline is without internet access, even by cell (assuming one would want to use up all your cell data doing this). I had to wait until we stayed in a marina weeks later to upload then download the detailed data.]  UPDATE: Internet access to download Deeper  depth data no longer required!

After downloading the detailed data into a CSV textfile, I reviewed the Redonda Bay tide data (obtained using a tide app based on XTIDES; inaccuracies can occur), and used Excel to correct the depths to zero tide ("datum"). I then converted a CSV text file of these data to a GPX file using GPSU Import File Converter and then GPS Utility, both available from Alan Murphy's https://www.gpsu.co.uk/.  Note: these corrections are not official; it is safest to assume they could err by 0.5m.

The depth data included 747 soundings... far too many. I decided to reduce the data to (i) depth less than 2m (6.6 feet) as well as (ii) a "safe" route for most boats (unless your boat draws 8 feet!). These data are plotted on a geo-referenced satellite image of the narrows.

As shown below, I converted image to a kap chartfile (which can be read by most charting software, but not onboard dedicated chartplotters), and saved the <2m waypoints and safe route into a GPX file (which CAN be read by most dedicated chartplotters, after conversion, as well as most charting software).  For those wishing to download, see below.


Note the "+" on the CHS chart is a little north of the actual rocks. The blue line indicate the "safe" route (for Pelagia, at least). 

UPDATE (March, 2021): Paul Higgins has updated his excellent SAT2CHART program to now input depths (in the form of a XYZ file). Below is screenshot of a MBTILES (better than kap) file:

MBTILES file with subset of depths added (in metres). Safe route in blue. Yellow depths are <2m

Now, I have to go kick myself for providing information that makes it easier to enter Von Donop and perhaps increasing the summer crowds. Just kidding! (Although VonDonop is indeed very crowded in July/August!) 

Hopefully this detailed information make entry/exit safer for all. For added safety, subtract 0.5m from the depths to account for possible errors in tide-level correction.

Nevertheless, even with this detailed information, we still go very slow by the rock... one never knows what's lurking below.

Stay safe!


CLICK HERE (updated Mar 14, 2021) to download from Google Drive, the zip file containing the above information, including:

  • Detailed description and instructions, as well as caveats
  • geo-referenced satellite image kap file
  • geo-referenced satellite image MBTILES file, WITH DEPTHS (in metres)
  • GPX file containing <2m depth waypoints and "safe" route waypoints

NOTE: Use at your own risk; there are no guarantees these will be safe for you.

Wednesday, 16 May 2018

Canadian nautical charts: C-MAP and/or Navionics NOT always up-to-date

More than a year after chart update available, Navionics and C-MAP charts still missing CHS Coward's Cove data

In preparation for our cruise to Haida Gwaii this Summer, we are updating our Canadian Hydrographic Service (CHS) charts. We are also comparing them to the C-MAP and Navionics commercial charts we use on our chartplotter (C-MAP) and occasionally on our Android (Navionics).

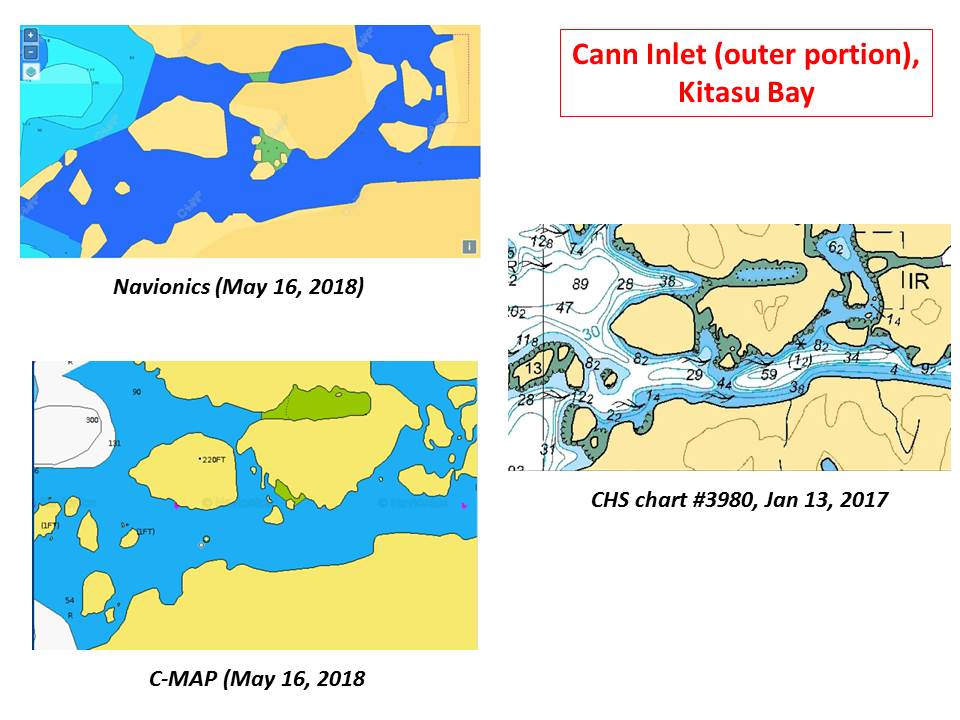
We are finding the commercial charts do not include all updates provided by CHS. [A CHS chart subscription allows regular updating (at least monthly) for 24 months.] For example, CHS chart #3980 was revised in January 2017, with substantial additional survey information for the Kitasu Bay area (Swindle Island/Laredo Sound). As of May 2018, neither C-MAP nor Navionics included this information.

The charts above show the Navionics, C-MAP and CHS chart information (at a display zoom showing the maximum information available*) for "Coward's Cove" (unofficial name) at the northern portion of Kitasu Bay. It is a good anchorage after passing through Meyer's Passage; we anchored here in 2007 when no CHS survey information was available. Although still sparsely surveyed, the current CHS chart now provides enough information to make one feel comfortable entering the cove. Note, however, that the CHS chart also/still fails to indicate the large rock at covering the western half of the entrance channel! (Kevin Monahan of Shipwright Productions produced a chartlet including Coward's Cove in the 1990s.) Neither C-MAP nor Navionics provides any information on depths or hazards in this cove.


Cann Inlet is close by (to the east of) Coward's Cove. The outer half of this inlet is well-surveyed in the 2017 CHS chart (the inner half remains "unsurveyed").  As with Coward's Cove, neither C-MAP nor Navionics show the detailed depth and hazards information provided by the CHS chart (indeed, they show essentially no information).

More than a year after chart update available, Navionics and C-MAP charts still missing CHS Cann Inlet data

C-MAP and Navionics charts covering the British Columbia coast are much less expensive that the equivalent set of CHS raster charts. (Indeed, Navionics and C-MAP charts for iPad and Android are inexpensive.)  However, as the above demonstrates, these commercial charts do not necessarily keep up-to-date with CHS charts and surveys.

Our boat Pelagia's safety (and ours) is worth paying the higher price of official CHS charts.

In practice, we use the C-MAP charts on our cockpit chartplotter, but double check these with updated CHS raster charts (which we often run simultaneously on Android at the helm).


* Navionics (and to a lesser extent, C-MAP) offers chart views with additional depth information ("Sonar Charts"). In many cases, this increased "detail" appears to simply be an interpolation between surveyed depths (i.e., not real depth data). In places with sparse depth surveys, these interpolations are at best, guesses. In other cases, the increased detail may derive from community-derived (crowd-sourced) depth information. It is not made clear where the data comes from. In the latter case, there is no accounting for variables such as tide level, location of depth transducer on hull, accuracy/inaccuracy of transducer calibration, or errors due to sea bed (e.g., weed or kelp giving erroneous readings). The internet has numerous examples of problems (for example: 1, 2, 3, 4) with these crowd-sourced Navionics Sonar Charts. I wouldn't touch them.

Thursday, 22 February 2018

Cruising British Columbia: Keep your charts updated...

North coast of British Columbia: Rocks keep being found, charts are updated, and new chart editions produced

We've written several posts about electronic nautical charts, especially in Mexico, and have noted that commercial charts, such as Navionics, are not always as up-to-date as the official national charts. Returning home to Canada in 2015, it was a relief to be back in well-charted waters.

Well, not always.... But at least Canadian charts are regularly updated, as well as new chart editions being produced.

Pelagia's Furuno chartplotter uses vector charts from C-Map, which we assiduously update each year (at a cost of about C$120/yr). However, we have learned to always compare these vector charts with our Canadian Hydrographic Service (CHS) charts (in raster format), as they are regularly updated (as much as monthly, when required). We also feel less likely to miss a charted hazard on a raster chart compared to a vector chart (learned many years ago, from direct experience unfortunately).

With the excellent CHS charts available here in Canada, it is too easy to become a little less attentive to keeping charts updated. Especially given CHS raster chart packages are pretty pricey (C$522 for all of BC coast). However, their purchase includes two years of chart updates (online), effectively giving one updated charts for three summer cruising seasons. (Sure. It would be nice if CHS would provide our charts for free, as is the case for NOAA charts in the USA. As CHS notes, however, "domestic, fiscal and social policy" is different between the USA and Canada. Yes, indeed. So, given the choice.... ).

Preparing for our cruising this coming Summer (back to Haida Gwaii!), I've started looking into changes in charts since we were last up there in 2011. I'm finding many. New surveys, new charts and, unfortunately, I guess boaters finding rocks. Here are just two examples (in places we are likely to go; see small scale chart above):


Rock in passage between Penrose Island  and unnamed island at North end of  Klaquaek Channel (Rivers Inlet):


Absent on charts earlier than 2016, somebody must have found this rock the "hard" way (shown by the "+" in the circle, indicating "underwater rock of unknown depth, dangerous to surface navigation").


"New" rocks in Windy Bay, Lyell Island (Haida Gwaii)


I found this update after I read a recent local newspaper report of a charter sailboat (that takes guests on week-long cruises in Gwaii Haanas National Park Reserve) hitting rocks in Windy Bay, a main stop for cruisers in the park. Don't know if  this is the rock it hit, but: in place of a 5.8m sounding and kelp (pre-2011), there are now two rocks (one awash at chart datum, and the other drying at 0.4m tide level).


Pelagia is too valuable to us to take chances without having the most up-to-date, official* CHS raster nautical charts. C$522 for 3 years seems a small price to pay for the added security. In practice, we compare our C-MAP and CHS charts in advance and then, in tricky areas, we run both the C-MAP charts on our chartplotter and the CHS raster charts on our Android tablet (with both in the cockpit).**


*Technically, CHS raster navigational charts do not satisfy ECDIS requirements for ships over 100 tons. However, Canadian chart carrying regulations make exceptions for ships under 100 tons, provided they have sufficient "local" knowledge. This includes: the location and character of charted lights buoys, marks, shipping routes, navigational hazards, and prevailing navigational conditions, such as ice, tides, currents, and weather patterns.

** We do have and occasionally use Navionics charts (on our Android tablet). However, we prefer C-MAP vector charts, and even more so the CHS raster charts. We have considerable distrust for "Community Edits", especially when it comes to hazards such as rocks, as well as anchorage suggestions.

Monday, 30 January 2017

Free 2017 Waggoner Cruising Guide (from publisher)


The Waggoner Cruising Guide is a very useful guide for cruising in Washington and British Columbia. 

Amazingly,  the publishers offer a free download.  (Many,  I expect,  would then purchase the paper copy after seeing the guide's usefulness.) 


Thank you to the publishers!

Thursday, 19 May 2016

Mexico charts: C-MAP versus NAVONICS

This post provides further information for cruisers considering/planning a cruise to Pacific Mexico. Preceding posts include: (i) Charts, Cruising Guides & Weather Sources for Mexico, (ii) C-MAP vs SEMAR charts, (iii) CM-93 vector charts, and (iv) using Google Earth and GE2KAP to create GPS-accurate GE image "charts". 
 

UPDATE March 2022: See new post on "Best chartplotter and chart source for Mexico: OpenCPN & O-CHARTS"

UPDATE 2021(Jan): For the locations noted below, both C-MAP and Navionics now show the same updated details. However, the newer more-detailed SEMAR raster chart (but not included in the SEMAR vector set) for "the islands" in Bahia de la Paz (THE main cruising area for boats out of La Paz, BCS) is missing from CMAP and incorrect for Navionics (I prefer "no data" to "wrong data"!)

The differences noted below in this 2016 post show the kind of differences that can exist (the ones below are now corrected). The only way to know if a commercial chart is updated is to compare to up-to-date SEMAR charts.


2016 post:
In a number of preceding posts, we've noted that in some places in Mexico, "up-to-date" Navionics charts lack the updated detail found in "up-to-date" C-MAP charts.

Increased detail in a chart does not guarantee the chart is more "accurate"; however, it likely indicates the chart has added in updates from the official Mexican nautical chart supplier, SEMAR. 

Below are several examples in the Sea of Cortez (and south to San Blas) where we've found Navionics charts lacking in detail compared to C-MAP charts. Readers may find the opposite in other areas (although we have not seen this).

In the examples below, the C-MAP image is always on top and the Navionics on the bottom. Each is zoomed so that the maximum detail available is shown.


La Palmita anchorage (south of B. Conception):


Loreto:


Altata:


San Blas/B. Matanchen:


Cruisers should use multiple sources of information rather than relying solely on only one commercial chart source (e.g., Navionics or C-MAP). Given the relatively low expense of Navionics and C-MAP electronic charts, especially on IOS and Android platforms, it makes sense to use both (as well as charts from CM93, GE-image, Blue Latitude Press, and, if you have them, SEMAR).

Importantly, as we have seen up in BC waters, commercial charts such as Navionics and C-Map are often not up-to-date with official chart sources (and may take months to over a year to include an update).

Both Navionics and Jeppesen/C-MAP provide methods to report a "Cartography Discrepancy". However, these require some work to submit, and for large areas where a chart does not include the most up-to-date cartography provided by the official cartography office (in this case, SEMAR), it would seem the responsibility of the electronic chart provider to keep their charts for sale to the public up-to-date!  

Sunday, 20 March 2016

What year are your CM93 electronic charts? Make sure they are the "latest"! (HOWEVER: ALL CM93v2 charts are OUT-OF-DATE!)

 ******************************************************************************
UPDATE/COMMENT: This post concerning "CM93" charts is proving to be very popular. It must be noted that CM93 Version 2 charts are usually far from being "up-to-date"; certainly NOT the best charts"available, so users of these charts must be cautious. Often, they are totally out-of-date, and dangerous. In some cases, C-MAP or Navionics electronic charts (which are fairly inexpensive on Android and IOS platforms) may be more accurate. However, as we have noted in other posts, Navionics or CMAP charts may also not be fully up-to-date.

NOTE that Mexico's SEMAR issues new charts every year (as well as updates). For example, in 2018, SEMAR issued a new, detailed, chart for the islands in Bahia de La Paz. (Unfortunately, this chart is available only as pricey paper chart or Raster, and not in their vector/ENC collections (such as excellent O-charts).

THIS POST offers the best solution for electronic charting in the west coast of Mexico: OpenCPN, O-Charts Pacific Mexico, and Blue Latitude garbour charts, plus a couple SAT2CHART/SASPLANET charts to fill a couple "holes".
******************************************************************************

CM93 vector electronic charts, covering the whole world, are shared widely among cruisers; they are also available from some sites on the web. Technically, these charts are "pirated", so user beware....

[Note: By "latest", we mean the most recent CM93 available which works in OPENCPN]

CM93 "version 2" charts are easily used in the open-source, freely available, OPENCPN navigation program (CM93 "version 3" charts do not work in OPENCPN).

When we were planning to sail to Mexico, a cruising friend gave us a copy of the CM93 charts. We were impressed that they covered the globe; we were less impressed when we saw their lack of detail. This was especially the case when we left the highly accurate (and free) raster charts of the USA and entered Mexico. In Mexico, we quickly learned (i) our CM93 charts were nearly useless, (ii) our updated CMAP charts (on our chartplotter) were much better, and (iii) in many (most?) places, even our up-to-date CMAP charts provided insufficient detail.* As we note in our earlier blog posts about charts and guides (as well as comparing official Mexican SEMAR charts with CMAP charts), we did not feel confident navigating close to shore until we reached Cabo San Lucas where we could finally use the excellent Blue Latitude Press cruising guides, with their excellent, detailed chartlets and accurate waypoints.

[*Our experience with Navionics charts in Mexico indicates they suffer similar problems as CMAP charts; indeed, we note areas where CMAP has important detailed updates not found in the Navionics. See our blog posts concerning CMAP, Navionics and SEMAR charts.]

It turns out, we were using a very out-dated version of  the CM93 vector charts, dated mostly before the year 2000. Since returning home, we have found CM93 version 2 charts dating as late as 2012. The differences (improvements) over the years are substantial.

To help other cruisers, the examples below show the improvements in the CM93 charts for the years "2000", "2007" and "2012" (dates are approximate).


Turtle Bay/Bahia Tortugas (Baja California Sur)
Our first real experience with CM93 charts coming in to an unfamiliar bay. 

Our circa-2000 CM93 chart was useless: no details, no depths, and the datum way off (on the other hand, the CMAP turned out to be pretty good).


The circa-2007 CM93 has much more detail and correct datum, although lights were not correct.


The circa-2012 CM93 chart for Turtle Bay is quite accurate (determined using GE2KAP and Google Earth (see this blog post) -- we wished we'd had it back in 2013!


La Paz, Baja California Sur
Both our circa-2000 CM93 charts and our CMAP chart showed few details and were inaccurate for the section from (and including) Bahia Los Frailes, to Ensenada de Los Muertos, the Cerralvo Channel, and finally, the San Lorenzo Channel entering Bahia de La Paz (they still are...). The Blue Latitude Press Sea of Cortez cruising guide was a godsend.


We entered the narrow, dogleg channel entering La Paz harbour just as the sun began to rise (we had left Los Frailes in the morning and done an overnight trip from Los Muertos in order to beat a Northerly, accurately predicted to come fiercely the next day). The circa-2000 CM93 chart showed NO details; fortunately, the CMAP chart showed good detail which turned out to be very accurate (though we did not know/trust this at the time).


Again, we wished we had the 2012 CM93 charts as confirmation of the CMAP (and Blue Latitude Press) information.


Punta Sabalo/Estero de Sabalo/Marina Mazatlan

In late April 2014, it was time to sail across the Sea of Cortez to Marina Mazatlan in the Estero de Sabalo, where we planned to keep Pelagia for the 2014 hurricane season. Again, our circa-2000 CM93 charts were useless. Our CMAP chart was also incomplete, although it had much more and better information than CM93 (the June 2014 CMAP update provided much more information for this area).


The circa-2012, CM93 chart shows an outline of the Marinas in the Sabalo Estero, but with few details. Fortunately, the combination of our CMAP charts and the Blue Latitude Press Pacific Mexico guide gave us the information we needed.


Other places in Mexico where CM93 2012 charts are inadequate (or useless) compared to official SEMAR charts: 

The list is too long. 

But, for example:

Puerto Los Cabos (San Jose del Cabo): nonexistent on CM93

Marina Coral (Ensenada): nonexistent on CM93

Marina Costa Baja (La Paz, BCS): nonexistent on CM93

"The Islands", Bahia de la Paz (new (2018) detailed chart): nonexistent on CM93

Topolobampo: details nonexistent on CM93

Bahia de Altata:  details nonexistent on CM93

Marina at La Cruz and Paradise Marina (Banderas Bay): nonexistent on CM93

The list goes on and on.... 


CM93 charts in Canada?

After seeing these large changes (improvements) in the various versions of the CM93 charts, we wondered how the CM93 charts would look in our home waters in British Columbia.#

The circa-2000 CM93 charts are terrible for BC waters, even on the south coast of BC (even though most areas in 2000 were exquisitely charted by the Canadia Hydrographic Service (CHS) as well as preceding (mostly British) cartographers). However, by 2012, the CM93 charts are quite good.

Further north in British Columbia, there remain "pockets" of unsurveyed (or poorly surveyed) coastline -- almost all well away from typical routes. One area is "Lady Trutch Passage" on the Central Coast near Bella Bella. This passage always looked inviting, but was choked with narrow passages and no chart was available. However, in 2011, the CHS produced a new very detailed chart including Lady Trutch Passage. Interestingly, the circa-2012 CM93 chart includes this detailed information; the circa-2007 CM93 chart as a subset of this new charting; and predictably, the circa-2000 CM93 "chart" is hopeless for this area, even for the relatively well-traveled (and well-charted for years) "Perceval Narrows".

Circa-2000 CM93 "chart" for Lady Trutch Passage area: USELESS


CM93 "2007" chart for Lady Trutch Passage area: VERY incomplete


Pretty good, detailed CM93 "2012" chart for Lady Trutch Passage area


Obviously, anything "new" since 2012 (marinas, rocks, shallows, buoys... etc) will not be correct on the "latest" CM93 v2 charts (approx 2012).

(# Legally, in Canada, vessels must carry up-to-date CHS charts, so technically, circa-2012 CM93 charts are not sufficient; of course, neither are CMAP or Navionics charts.)


Before we sailed down to Mexico, we wish we had been aware of the substantial changes in the CM93 electronic charts. We should have been... but we were probably too wrapped-up in too many things as we prepared to sail to Mexico, and as were were on our way down the coast.

Hopefully, some cruisers heading offshore will find this blog post helpful!