Showing posts with label Boat gear. Show all posts

Wednesday, 1 July 2026

A new "iron genny" for Pelagia! (Betamarine Beta50)

Installed: Pelagia's new Betamarine BETA50

 HAPPY CANADA DAY! 

Our trusty Yanmar (4JHTE) was getting on in years (37 yrs!) and hours (~6600 hrs). It was running well but showed several signs of upcoming issues, some quite pricey. (We received a "worst-case" scenario quote of C$22k!)

We decided to repower. 

We looked into getting a new Yanmar, but were put off by several issues: (i) Yanmar's base price was 2x a Betamarine Beta50, (ii) the Yanmar technology was more-advanced "common rail" relying on a electrical control unit (ECU) -- the problem was this would be more sensitive to fuel issues and any repairs would require a Yanmar dealer/mechanic, something not easily found North of Campbell River, and (iii) for the install, the local Yanmar dealer required Pelagia to be hauled out for an unspecified duration (add $$) and there have been issues with work timing here in Vancouver.

We decided on a Betamarine Beta50. The engine is a marinized version of a Kubota tractor engine, so parts and diesel mechanics are easily available. The technology is more simple, thus easier to maintain and repair.

The installation was done by the Canadian Beta distributor Gartside Marine Engines in Sidney BC. We were able to bring Pelagia to their dock and the Yanmar removal and Beta50 install done while Pelagia was still in the water. (There was no charge for time at Gartside's docks.) 

Sad seeing the old Yanmar out of the boat...
 

Of course, the install took longer than planned (well, welcome to boats...), and Pelagia's 3-blade fixed propeller had to be "re-pitched" twice. The first sea trial resulted in smooth engine running but the engine RPMs couldn't get up to the 2800 specifications. This meant a 2nd propeller re-pitch was required. Also, the propeller produced a very loud "singing" for RPMs between 1000-2000 rpm -- something the propeller wizards could correct. The 2nd re-pitching added another week, BUT the end result was success: no more propeller singing and no problem getting RPM up to 2800.  

We've had a few cruising days with the new engine: 2 between the second re-pitching (as the problems were discovered on a Friday), and 4 getting the boat back home to Vancouver (including a raucous sail across Georgia Strait).

Gartside also completed some other improvements, such as (i) all-new sound insulation of the engine room after cleaning, (ii) moving the external regulator so that it is now easily accessible, and (iii) new raw water strainer that was moved to a new, easily accessible location.

We also purchased (as an addon) a "NMEA2000" module for the Beta50. David ran cables and hooked this up to our existing NMEA2000 network (upgraded to allow more instruments) yesterday and now we have engine RPM, TEMP and OIL PRESSURE on our chartplotter in the cockpit.

Furuno chartplotter engine display (sample)

SO FAR, we're happy with our new Beta50. The process took longer (4 weeks rather than 2 weeks) than expected, wasn't cheap (but FAR FAR LESS that what a Yanmar installed in Vancouver would have cost us!). We definitely would recommend Gartside Marine Engines (Sidney, BC). 

Hopefully it keeps Pelagia going for many years to come.    

Now for some Summer cruising.... 

Friday, 19 September 2025

A new stove for Pelagia

In its box, ready to install


Our old Force 10 stove was about 40 years old. It had served its two owners very well. Lately, the burners were burning yellow and sometimes poofing (?) out. Michelle suggested she wanted a new stove for her birthday. David worried about the cost (well over C$3000) but started looking, daunted by the thought of the money and all the work required. 


Old dependable no more...
It was the propane sniffer (rather, multiple sniffers) that quickly made up out mind. Suddenly, we had 3 different sniffers telling us there was a leak. So, time for a new stove.    

We looked into both Force 10 and Dickinson stoves. A review on YouTube thankfully made it clear the Dickinson wouldn't work for us: https://www.youtube.com/watch?v=aRuda57AHk4

D read and re-read the Force 10 literature, and finally got help re sizes directly from folks at Force 10 (here in British Columbia). The North American Standard size would fit (both 3- and 4-burner models were identical sizes) our stove space. They were now 2-3 cm taller, but still would fit. 

The 4-burner was C$1000 pricier, was not in stock so might entail a substantial shipping charge, and would require about 4 weeks for delivery.  (In the 17 years we've had Pelagia, we've never used all 3 burners on our old stove.) The 3-burner Force 10 was in stock at Steveston Marine, and I could pick it up in 2 days. No delivery charge. The price was not cheap (~C$3700 with taxes)... we could buy 2-4 stoves at Home Depot for home for that price. Yeah, it's a boat, so special boat prices. 

I had some help from neighbours on the docks at VRC lifting the stove into the boat (Thank you Jonathon and Greg!). After some minor modifications, the stove fit beautifully and gimballed back-and-forth perfectly. And it is very shiny.

AND! No more propane sniffer alarm! 


The shiny new Force 10 3-burner installed


Video: gimballed stove heating up kettle while we sail across Strait of Georgia

Saturday, 26 March 2022

The best chart package combination for Pacific Mexico: OpenCPN and O-CHARTS

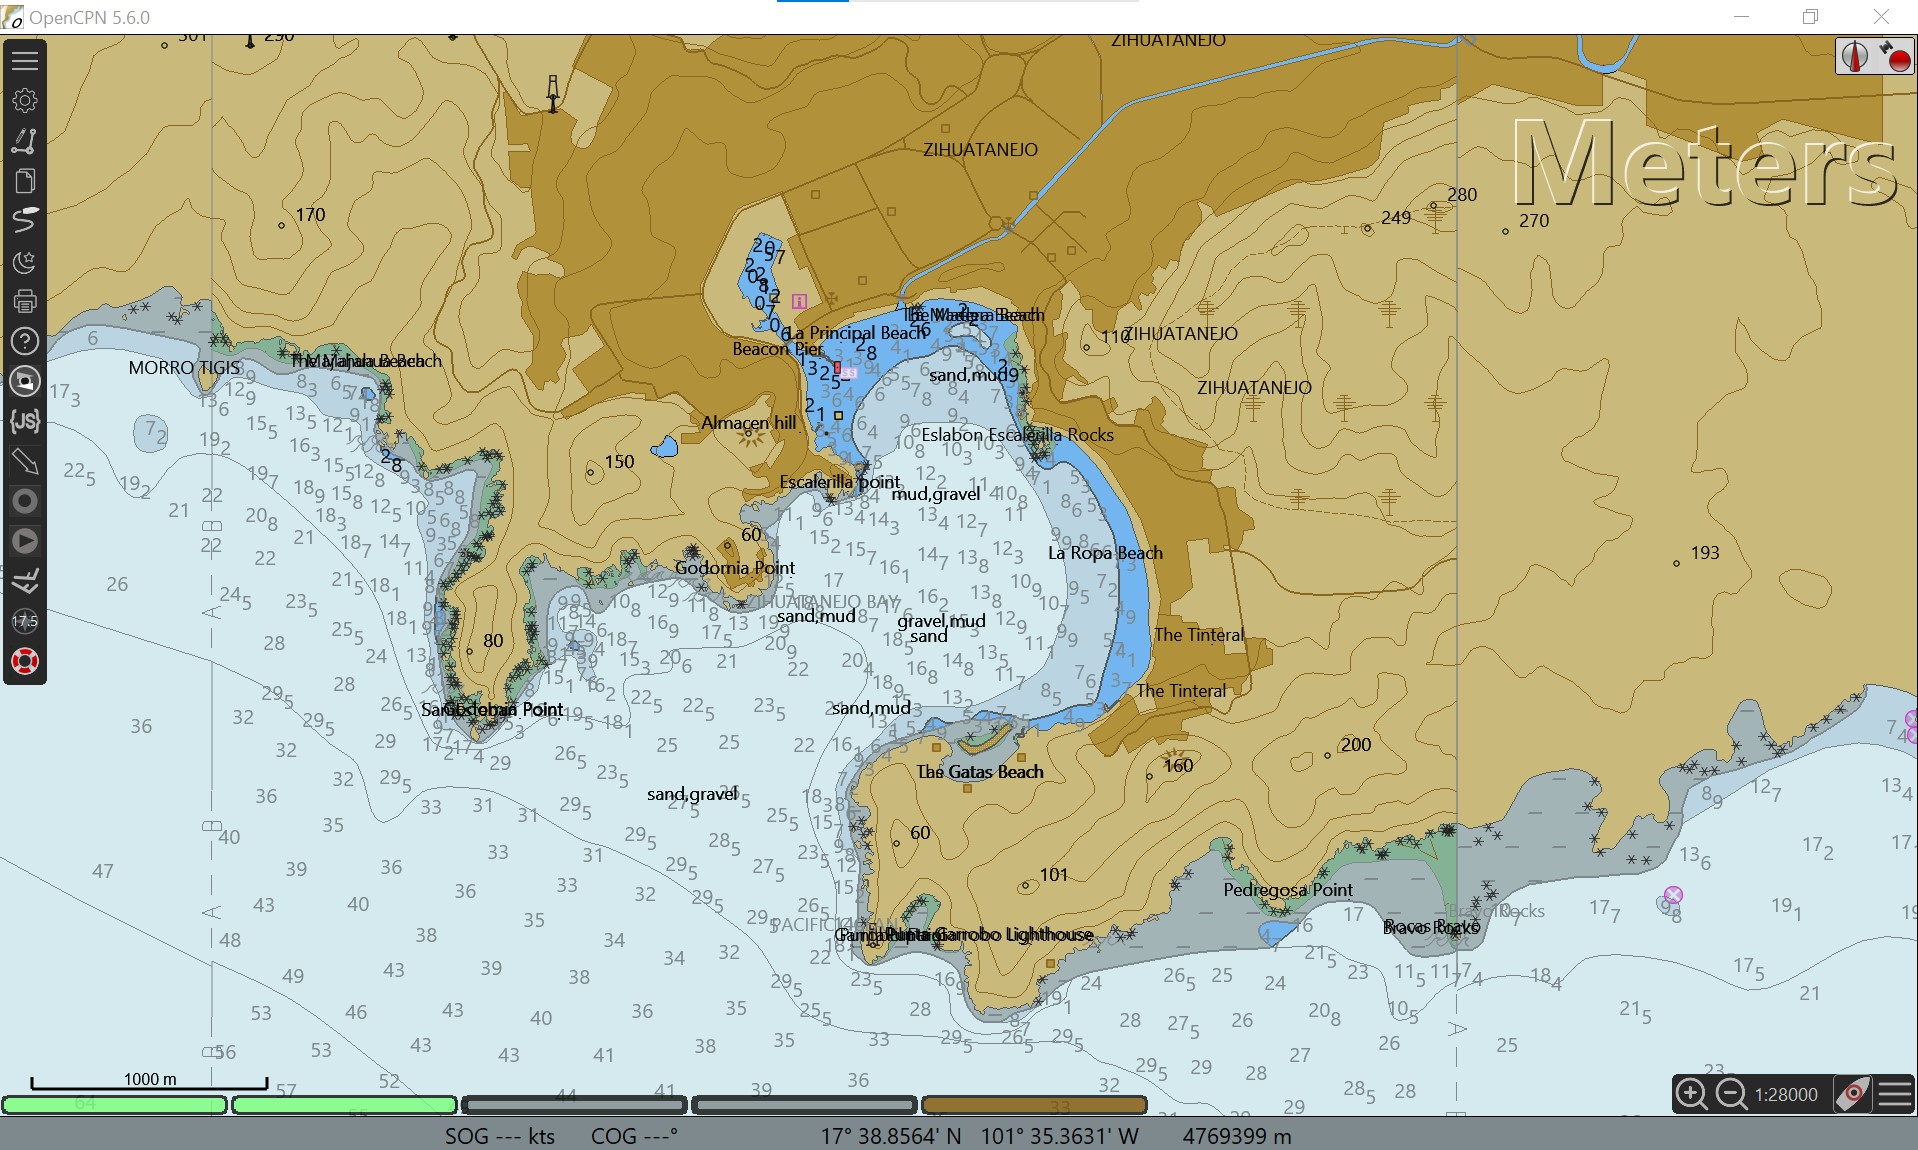
Zihuatanejo harbour (O-Charts & OpenCPN)


Best charting package: OpenCPN

(when combined with charts available for OpenCPN)

I have long touted OpenCPN. It is the most (or among the most) full-featured charting packages. It is continuously being updated/upgraded with new features, and support easily obtained.

My favourite OpenCPN features:

  • Accepts most chart types: Raster [BSB/KAP (such as CHS and NOAA raster files), mbtiles; Vector (S57 ENC (such as free NOAA files), some S63, CM93v2, and  O-SENC]
  • Excellent waypoint creation and management
  • Excellent route creation and management
  • Presentation of AIS target information 
  • VDR (Voyage Data recorder): Save depth, AIS, etc data for later re-playing (and creation of depth surveys) 
  • and much more!

This open-source charting package is available free for PC, MAC and Linux, and for a very small one-time fee for Android. (Due to Apple's iOS licensing issues, OpenCPN is not available for iPhone or iPad.)


Best source of charts for Mexico's Pacific Coast: O-Charts

I've recently had the opportunity to review the O-Charts (Open Charts) Mexico charts. I've focused on the Pacific coast.


(1) O-Charts' SEMAR charts:

A new addition, O-Charts now offers official Mexico charts from Mexico's SEMAR. Charts are in two sets, one for Mexico's Pacific coast and the other for Mexico's Gulf of Mexico coast. Each chart set is offered for a very reasonable price (26 to 30 euros/set), which includes free updates for 1 year (update frequency is reported to be weekly). Most of these charts are fairly recently issued and/or have received recent updates. They are not old charts "from the 1800s" so often alluded to by misinformed cruisers.

SEMAR (O-Charts): Entrance to Sabalo (Mazatlan)

SEMAR (O-Charts): Sabalo (Marina Mazatlan)

Pacific Mexico: The O-Charts' SEMAR packages are from SEMAR's ENC (vector) charts. NOTE: Although extensive, the SEMAR ENC collection is missing several charts from their RASTER collection. This means a few key locations for cruisers are missing from O-Charts' SEMAR package. With two exceptions (see below), these few locations on raster charts missing from SEMAR ENC are all easily replaced by also purchasing Blue Latitude raster charts from O-Charts.

Commercial chart sources, such as Navionics and C-MAP, all obtain their Mexico chart information from SEMAR. Sometimes these commercial charts include data from both vector and raster from SEMAR are included, other times only vector. 

However, it is important to note that SEMAR data (and thus Navionics/C-MAP) usually does not cover popular small-boat anchorages. 

The solution is to add Blue Latitude charts, as shown in the following example for Isla San Francisco, below:


Navionics: no data for Isla San Francisco

SEMAR (O-Charts): no data for Isla San Francisco

Blue Latitude (O-Charts): Detailed Isla San Francisco
Blue Latitude (O-Charts): Detailed chart for Isla San Francisco (from guidebook)


(2) O-Charts' Blue Latitude charts: 

O-Charts has for some time offered the two Blue Latitude chart sets for the Sea of Cortez and Pacific Mexico (36 euros per set). These chartlets, found also in the excellent Blue Latitude guidebooks, provide GPS-accurate charts for all the main harbours and hundreds of small-boat anchorages on Mexico's Pacific coast (excluding the west coast of the Baja peninsula). NO other charts provide such detail.  

These charts are essential for west coast cruisers.  


For cruisers, the combination of SEMAR and Blue Latitude charts, both available from O-Charts, provide excellent coverage of Mexico's Pacific coast.


The two important exceptions:

O-Charts SEMAR Pacific chart set is missing detailed charts for two key locations for cruisers on the west coast of Baja: Turtle Bay and Bahia Santa Maria/Bahia Magdalena. Unfortunately, these locations are not part of the Blue Latitude chart sets, as they do not cover Baja's west coast. 


There are easy solutions for charts for these two Baja locations:

  • Most up-to-date chart cards for chartplotters (Navionics, C-MAP) will have detailed charts for these two Baja locations (derived from SEMAR's detailed raster charts)*
  • Navionics and C-MAP iOS/Android apps also contain detailed charts*


* Note: Navionics/C-MAP do not provide more detailed charts (compared to O-Charts' SEMAR) for other areas of the west coast of Baja. For the many poorly charted locations on Baja's west coast, I recommend making detailed satellite images (mbtiles are best) using SASPLANET/SAT2CHART and OpenCPN.

Monday, 7 June 2021

"UPDATED" NAVIONICS AND C-MAP CHARTS ARE OFTEN NOT "UP-TO-DATE" (Canada)

UPDATES (Sept 25, 2021): I have reached the conclusion that you cannot depend upon Navionics (or CMAP) charts to be "up-to-date" within a reasonable time. I find too many incidences of CHS chart updates (for new rocks, shallows, etc) that are not shown on Navionics, even several months later.  

In my view, relying solely/primarily on Navionics charts is not safe.

June 3, 2023: (i) There is new (May, 2023) CHS detailed charting for Tasu Sound (Haida Gwaii) on vector charts. Navionics does not yet include this new charting. Stay tuned! (ii) The new rock and sunken wreck in Thetis Island's North Cove charted by CHS in the Fall of 2021 are still not indicated on Navionics, 1.5 years later! 

December 2023: More than TWO YEARS LATER, Navionics finally includes Thetis Island North Cove updates  ALSO: Navionics now includes new Haida Gwaii charts (5 mos later...). 

February 2024: C-MAP finally includes the new (May/June 2023) Haida Gwaii Charts.


You may think (hope) that your just "updated" Navionics or C-MAP charts  are now "up-to-date". This is not necessarily the case (applies to both app and card-based updates).

Recently, checking "Notices to Mariners" (NOTMAR: https://www.notmar.gc.ca/monthly-mensuel-en.php) by Canadian Hydrographic Services (CHS), I noticed the February version indicated newly discovered rocks/shallows in the general area near Discovery Islands and Desolation Sound.

Below are images from official CHS Raster charts from May 2020 and June 2021:

The updated CHS charts (June, 2021) show the two new drying rocks in Manson Passage (top, right) and the 0.3m shallows in Plunger Pass (bottom, right). Both are dangerous to most boats (especially the shallow area in Plunger Pass, which we passed through last summer).


What about Navionics and C-MAP? As of June 7, 2021, neither show these updates. This includes the C-MAP App and C-Map SD card (card purchased in May, 2021) as well as the Navionics App (as well as the online viewer).

Manson Passage: Navionics (June, 2021, not accurate)

 
Plunger Passage: Navionics (June, 2021, not accurate)


Manson Passage: C-MAP (June, 2021, not accurate)

Plunger Passage: C-MAP (June, 2021, not accurate)

At least 3 months after CHS issued a NOTMAR about these rocks/shallows, yet they are still not shown on "updated" Navionics or C-MAP charts.


Update (August, 2021): Navionics finally updated the above locations by August 14th, 2021. By December 2021, C-MAP updated these locations.


HOWEVER:

The September CHS NOTMAR had new shallows, rocks and wrecks. For example: Here's another  "new" rock and a wreck (North Cove, Thetis Island) shown on the up-to-date CHS raster chart, but not (yet, as of November 20)) on the just-updated Navionics or CMAP:


Keep an eye out to see how long it takes Navionics (or CMAP) to include these updates! 

November 20, 2021: neither Navionics or CMAP have included this September update.)

January 2022: Navionics still doesn't include this update, whereas CMAP does. 

June 2023: Navionics STILL DOES NOT INCLUDE THESE HAZARDS (1.5 years after they were updated by CHS!)


IN CONTRAST, O-CHARTS SEEM TO QUICKLY UPDATE:

O-Charts (https://www.o-charts.org/) makes CHS ENC Vector charts available for OpenCPN  at a very reasonable annual price (20 Euros for Pacific Coast of Canada). These charts can be updated monthly, and are supposed to be the same as CHS ENC charts. 

(OpenCPN is an excellent free/near-free chartplotter software for Windows, Mac, Linux and Android.)


By March, 2021, the O-Charts for Manson and Plunger Passages included the February update:

Manson Passage: O-Charts (March, 2021 -- accurate!)

Plunger Passage: O-Charts (March, 2021 -- accurate!)


Update: just checked earlier NOTMAR editions: current Navionics and C-MAP missing more rocks/shallows in other areas of BC! (O-charts, however, are correctly updated.)


CONCLUSION: Commercial charts such as Navionics or C-MAP may NOT be up-to-date (even though you just "updated" them). "New" rocks and shallows shown on up-to-date official charts may be missing on Navionics and/or C-MAP!


On Pelagia, we ensure our CHS charts are up-to-date. Though we also have Navionics and C-MAP, we but put much greater trust on the CHS raster charts (we are still getting used to the O-charts -- so far, so good.)


Monday, 8 March 2021

Saving depths as you go...


 UPDATE, March 26, 2024: revised version (adds UTC time to output; minor fixes) uploaded [NMEAtoXYZ-3c]


This post is part of a series concerning obtaining/creating more-detailed depth information.

Note: this particular post is technical and may not be of interest to some....


Entering an unfamiliar (and poorly charted*) bay, it would be nice to have a record of depths as we explore. In such cases, however, one must focus on safely navigating, rather than noting down or saving depths.

* In B.C., many bays and coves on up-to-date, decently charted areas often have only a few soundings.


OpenCPN Voyage Data Recorder

Our GPS, AIS, and depth/wind/speed information are now available via WIFI for use by our ship's computer and Android tablet running OpenCPN chartplotting software. OpenCPN is fantastic. Among its many free plugins is the "Voyage Data Recorder", or VDR. When VDR is set to "record", it saves all the NMEA sentence information (including AIS, latitude, longitude, depth, etc) into a text file, until the recording is stopped. A short example of a NMEA text file is shown below:

Sample section of a NMEA text file

In the above sample, !AIVDMs are NMEA sentences for AIS info, $IIDPTs are depths, $IIMWVs are wind, $GPVTGs are speed and course over ground, and $GPRMC, $GPGGA, $GPGLL sentences provide GPS location (Lat/Lon), time, date, course and other GPS information.

The depth information in a NMEA text file does not contain location (Lat/Lon) info. However, there is always such information within less than a second of the depth sentence. We have written a short program to associate NMEA depth info with location, and to save these depth points into two types of files. NMEAtoXYZ is a simple program for Windows PCs that inputs a NMEA text file, and outputs (i) a GPX file of depth waypoints, and (ii) an XYZ file of the same points.  The program gives the user the option to correct depths for tide level (recommended), and to determine the spacing (in time, thus distance) between depths. #

A GPX file can be imported into any GPS or chartplotter. The XYZ file can be used by software to produce satellite image chartfiles WITH depths plotted (see below).


The following screenshots show the process and output:

Playback of VDR recording in English Bay. Pelagia is shown as the red boat with a red trail. [The green triangles represent AIS broadcasted from anchored (black dot) and moving (with line of projected course in front) ships.]


Zoom in on Pelagia (with Tug & Tow heading in opposite direction)


NMEAtoXYZ-3a: GPX output

Depth waypoints (S2Z22 highlighted) saved to GPX by NMEAtoXYZ program


Waypoints are coded in two ways: Arrow symbol and 1st two characters of waypoint name

S2xxxx: Magenta arrow: Depth >20m

S1xxxx: Blue arrow: Depth >2m to 20m

S0xxxx: Red arrow: Depth ≤2M

The symbols are specific to OpenCPN; the waypoint name will work with all GPSs and chartplotters


NMEAtoXYZ-3a: XYZ output

Using SASPLANET and SAT2CHART programs, the XYZ file's depths may be plotted on to a satellite image of the area. This image may then be displayed as a "chart" on OpenCPN. (Full details are explained in SAT2CHART's HELP pages.)

Satellite image chart with depths

The number of depths points plotted by SAT2CHART depend on the zoom factor (higher zooms = more points, when available)


One may also plot these depths on (i) an image of a Navionics chart (using SASPLANET & SAT2CHART) or (ii) on an existing raster chart using a GIS program such as QGIS.


Depths plotted on CHS chart (using QGIS)

The above examples are from Vancouver Harbour. Obviously, such a well-charted place does not require one to be saving depths and making image charts with depths are not required (it's just a test example).

However...

British Columbia still has some areas where nautical charts contain NO depth soundings (for example, parts of the West coast of Haida Gwaii). Even more common, many bays and coves in BC, even in Southern BC, have very limited depth details. A good example is the entrance to Von Donop Inlet/Ha'thayim Marine Park, which we described in a recent post. 

As we cruise this coming Summer, we hope to obtain more-detailed depth information for the places we visit using (i) the VDR feature of OpenCPN and the above programs, as well as (ii) more-detailed scans using our Deeper Pro+ portable sounder.


The NMEAtoXYZ program (with helpfile) is available free to download from the following link (USE AT YOUR OWN RISK!):

Download latest program update from this link:

https://drive.google.com/file/d/1-YGVXu7k-fYrXD9hWwD5g1E3f5U3m2q8/view?usp=sharing                                      

Note, it has only been tested on a PC running Windows (it MAY work on Linux and MacOS, but these have not been tested).  It is a very simple program (written using QB64), currently with no GUI.  NMEA VDR file plugin and OpenCPN are available for most platforms, except those running iOS. 


# FYI: Reefmaster is commercial software (US$200) that also will save depths with lat/lon, plus a lot more.

Monday, 29 June 2020

Windlass woes (and eventual win)

Windlass motor with broken "up" stub (circled)


June 16, 2020:

Can't always be fun and games.... 

Windlass problems occur every once in a while (in case you are wondering, the windlass is the equipment we use to raise/lower the anchor). But our problem turned out to be terminal: our positive "up" terminal had sheared off, and this meant the end for the motor. 

Of course, it happened when we had a lot of chain out (230'). Fortunately, back in 2008, we purchased a "manual recovery kit" for the windlass. Unfortunately, it was very hard work for David to bring it all up. Nearing the end, he was sweating hard and taking multiple breather breaks. But up it came. 

We headed to the docks of Refuge Cove, where David removed the motor/gearbox assembly. It did not look good (as we said, it was "terminal"). At least it was easy to remove. 

Next morning, we started making calls. First call was to Ocean Pacific Marine in Campbell River. Using our part number, they said it looked like it would have to be ordered from England. Yikes! We started planning a fast return to our docks in Vancouver. But, 20 minutes later, they us called back, saying there was a new part number and indeed, there was a replacement in Victoria. It was Friday morning and they should be able to get it to Campbell River by Monday "11ish".

Only $2300.... 

After a couple of nights at the dock at Refuge Cove (where we sorted out our backup - - and much lighter -- anchor line), we headed over to Gowlland Harbour (very near Campbell River) to try anchoring without a windlass for a couple of nights. Turned out to be a great anchorage (tons of room with only 1 other boat). Later, using a winch on the mast, we had no problem getting our anchor (with lighter line) up. 

Monday morning, we headed over to the Discovery Marina in Campbell River, where Ocean Pacific Marine was conveniently located. By 1130am, the new windlass motor assembly had arrived. After some concern it was the wrong part (it may have been mislabled... but phone calls to distributor indicated it would only fit properly if it were correct), David installed it (in between torrents of rain). And it worked! 

Next morning, we headed back over to Cortes Island, to Hathayim/Von Donop Marine Park, a favourite of ours. 

A pricey part, but still a "win" since we could do our own repairs, and get back  cruising. 

Wednesday, 16 May 2018

Canadian nautical charts: C-MAP and/or Navionics NOT always up-to-date

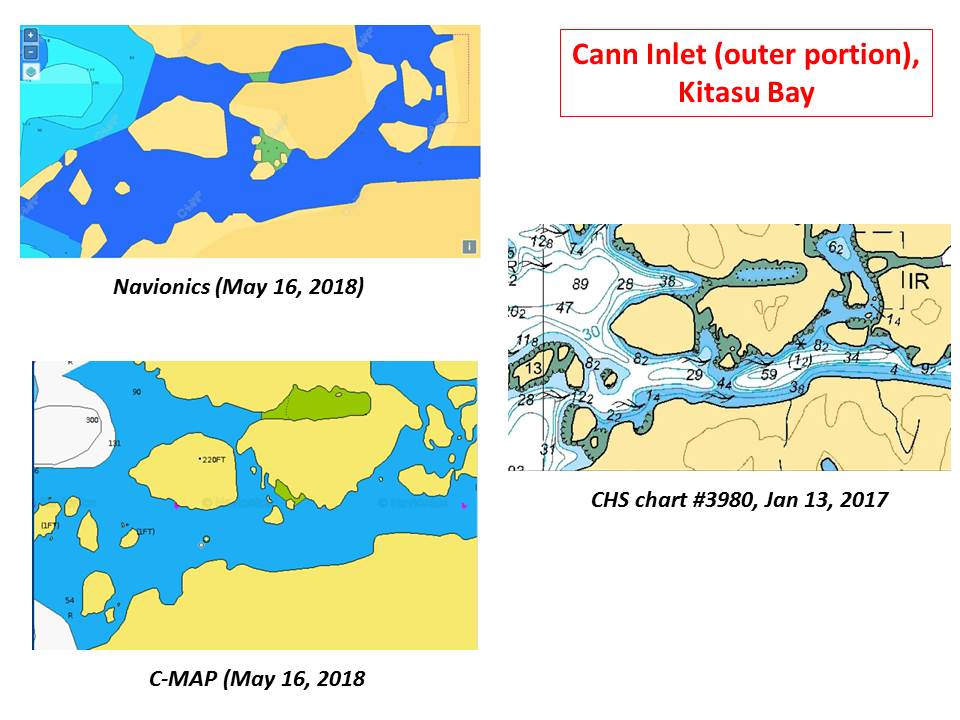
More than a year after chart update available, Navionics and C-MAP charts still missing CHS Coward's Cove data

In preparation for our cruise to Haida Gwaii this Summer, we are updating our Canadian Hydrographic Service (CHS) charts. We are also comparing them to the C-MAP and Navionics commercial charts we use on our chartplotter (C-MAP) and occasionally on our Android (Navionics).

We are finding the commercial charts do not include all updates provided by CHS. [A CHS chart subscription allows regular updating (at least monthly) for 24 months.] For example, CHS chart #3980 was revised in January 2017, with substantial additional survey information for the Kitasu Bay area (Swindle Island/Laredo Sound). As of May 2018, neither C-MAP nor Navionics included this information.

The charts above show the Navionics, C-MAP and CHS chart information (at a display zoom showing the maximum information available*) for "Coward's Cove" (unofficial name) at the northern portion of Kitasu Bay. It is a good anchorage after passing through Meyer's Passage; we anchored here in 2007 when no CHS survey information was available. Although still sparsely surveyed, the current CHS chart now provides enough information to make one feel comfortable entering the cove. Note, however, that the CHS chart also/still fails to indicate the large rock at covering the western half of the entrance channel! (Kevin Monahan of Shipwright Productions produced a chartlet including Coward's Cove in the 1990s.) Neither C-MAP nor Navionics provides any information on depths or hazards in this cove.


Cann Inlet is close by (to the east of) Coward's Cove. The outer half of this inlet is well-surveyed in the 2017 CHS chart (the inner half remains "unsurveyed").  As with Coward's Cove, neither C-MAP nor Navionics show the detailed depth and hazards information provided by the CHS chart (indeed, they show essentially no information).

More than a year after chart update available, Navionics and C-MAP charts still missing CHS Cann Inlet data

C-MAP and Navionics charts covering the British Columbia coast are much less expensive that the equivalent set of CHS raster charts. (Indeed, Navionics and C-MAP charts for iPad and Android are inexpensive.)  However, as the above demonstrates, these commercial charts do not necessarily keep up-to-date with CHS charts and surveys.

Our boat Pelagia's safety (and ours) is worth paying the higher price of official CHS charts.

In practice, we use the C-MAP charts on our cockpit chartplotter, but double check these with updated CHS raster charts (which we often run simultaneously on Android at the helm).


* Navionics (and to a lesser extent, C-MAP) offers chart views with additional depth information ("Sonar Charts"). In many cases, this increased "detail" appears to simply be an interpolation between surveyed depths (i.e., not real depth data). In places with sparse depth surveys, these interpolations are at best, guesses. In other cases, the increased detail may derive from community-derived (crowd-sourced) depth information. It is not made clear where the data comes from. In the latter case, there is no accounting for variables such as tide level, location of depth transducer on hull, accuracy/inaccuracy of transducer calibration, or errors due to sea bed (e.g., weed or kelp giving erroneous readings). The internet has numerous examples of problems (for example: 1, 2, 3, 4) with these crowd-sourced Navionics Sonar Charts. I wouldn't touch them.

Thursday, 22 February 2018

Cruising British Columbia: Keep your charts updated...

North coast of British Columbia: Rocks keep being found, charts are updated, and new chart editions produced

We've written several posts about electronic nautical charts, especially in Mexico, and have noted that commercial charts, such as Navionics, are not always as up-to-date as the official national charts. Returning home to Canada in 2015, it was a relief to be back in well-charted waters.

Well, not always.... But at least Canadian charts are regularly updated, as well as new chart editions being produced.

Pelagia's Furuno chartplotter uses vector charts from C-Map, which we assiduously update each year (at a cost of about C$120/yr). However, we have learned to always compare these vector charts with our Canadian Hydrographic Service (CHS) charts (in raster format), as they are regularly updated (as much as monthly, when required). We also feel less likely to miss a charted hazard on a raster chart compared to a vector chart (learned many years ago, from direct experience unfortunately).

With the excellent CHS charts available here in Canada, it is too easy to become a little less attentive to keeping charts updated. Especially given CHS raster chart packages are pretty pricey (C$522 for all of BC coast). However, their purchase includes two years of chart updates (online), effectively giving one updated charts for three summer cruising seasons. (Sure. It would be nice if CHS would provide our charts for free, as is the case for NOAA charts in the USA. As CHS notes, however, "domestic, fiscal and social policy" is different between the USA and Canada. Yes, indeed. So, given the choice.... ).

Preparing for our cruising this coming Summer (back to Haida Gwaii!), I've started looking into changes in charts since we were last up there in 2011. I'm finding many. New surveys, new charts and, unfortunately, I guess boaters finding rocks. Here are just two examples (in places we are likely to go; see small scale chart above):


Rock in passage between Penrose Island  and unnamed island at North end of  Klaquaek Channel (Rivers Inlet):


Absent on charts earlier than 2016, somebody must have found this rock the "hard" way (shown by the "+" in the circle, indicating "underwater rock of unknown depth, dangerous to surface navigation").


"New" rocks in Windy Bay, Lyell Island (Haida Gwaii)


I found this update after I read a recent local newspaper report of a charter sailboat (that takes guests on week-long cruises in Gwaii Haanas National Park Reserve) hitting rocks in Windy Bay, a main stop for cruisers in the park. Don't know if  this is the rock it hit, but: in place of a 5.8m sounding and kelp (pre-2011), there are now two rocks (one awash at chart datum, and the other drying at 0.4m tide level).


Pelagia is too valuable to us to take chances without having the most up-to-date, official* CHS raster nautical charts. C$522 for 3 years seems a small price to pay for the added security. In practice, we compare our C-MAP and CHS charts in advance and then, in tricky areas, we run both the C-MAP charts on our chartplotter and the CHS raster charts on our Android tablet (with both in the cockpit).**


*Technically, CHS raster navigational charts do not satisfy ECDIS requirements for ships over 100 tons. However, Canadian chart carrying regulations make exceptions for ships under 100 tons, provided they have sufficient "local" knowledge. This includes: the location and character of charted lights buoys, marks, shipping routes, navigational hazards, and prevailing navigational conditions, such as ice, tides, currents, and weather patterns.

** We do have and occasionally use Navionics charts (on our Android tablet). However, we prefer C-MAP vector charts, and even more so the CHS raster charts. We have considerable distrust for "Community Edits", especially when it comes to hazards such as rocks, as well as anchorage suggestions.

Monday, 5 October 2015

Heading down the Pacific coast of Baja California? Create GPS-accurate electronic "charts" using SAT2CHART and SASPLANET satellite images

UPDATE: See this post:

The best chart package combination for Pacific Mexico: OpenCPN and O-CHARTS  

Recommends combination of OpenCPN/O-Charts MexicoENC/Blue Latitude chartlets. Includes a link to charts for Turtle Bay and Bahia Santa Maria, missing from the SEMAR ENC-chart collection (for west coast Baja).  

UPDATE: Better image chart etc (from ArcGIS) for Abreojos BCS, plus link to download for Abreojos waypoint (gpx) and image (kap) files. Scroll to bottom. 

UPDATE:  I find it easier to make these charts using the combination of SASPlanet, ArcGIS ESRI, and SAT2CHART. MBTILES is the better format.

UPDATE: The "chartlocker" has free, pre-made, mbtiles of satellite charts for Baja (and elsewhere): https://chartlocker.brucebalan.com/ 

UPDATE: Google Earth images are reasonably good, but other sources provide even better (higher resolution/clearer images). I find Bing much better than Google Earth; sometimes better are the images from ArcGIS ESRI. Use free SASPlanet software to make charts from ESRI. "How to" explained here.


On previous posts, we discussed various charts, official Mexico nautical charts, cruising guides, weather sources, and  communications. In the current post, we discuss using GPS-accurate electronic "charts" derived from Google-Earth images to supplement navigation resources when cruising the Pacific coast of Baja California.

March 2016: see also post concerning CM93 electronic charts.

THE PROBLEM: When we left Ensenada in November 2013 to sail down the Pacific coast of Baja California, we had our first encounters with navigating a coast where charts were often out-of-date, inaccurate, and lacking detail.

We had two guidebooks, both new (2013) editions (Charlie's Charts; and  Rain's Mexico Boating Guide). We also had paper charts in a Yachtsman's Chartbook, and CM93 electronic charts -- both of which we could see, before leaving, were lacking sufficient detail and accuracy. Importantly, in addition to these, we had an up-to-date C-MAP chart card for our Furuno chartplotter (also usable in our computer). In some places, the C-MAP card showed much better detail than the CM93 or Yachtsman's charts; in many other places the C-MAP chart were also lacking sufficient detail. In contrast with the excellent accuracy of the C-MAP charts in the USA and Canada, we had no idea as to the GPS accuracy of these charts in Baja California.

Two nights and two days after leaving Ensenada, wanting some sleep, we considered anchoring on the east side of Cedros Island at an anchorage called "La Palmita", indicated by both guide books. However, without any information on a chart or guidebook chartlet, zero detail on the C-MAP chart, and a depth sounding far off of what we were recording, we chickened out and continued on to Bahia Tortuga (Turtle Bay) -- losing about 1 hour of valuable daylight.

No detail and inaccurate chart for Isla Cedros' La Palmita anchorage: well within the "10 foot" depth contour, we still had >150' showing; it didn't help that the anchorage waypoint was showing on land. So we gave up and headed for Turtle Bay. (Interestingly, only a couple nautical miles south, the chart became very detailed (i.e., C-MAP included the new Mexican/SEMAR chart for Cedros town, produced in 2012.)

With daylight fading, we just made it through the "Canal de Dewey" (narrow channel between Punta Eugenia & Isla Natividad) before dark -- with so many lobster traps, so much kelp, and reefs, combined with currents, we would never do Dewey in the dark.


In contrast to most anchorages down Baja's Pacific coast, the C-MAP chart for Turtle Bay had quite a bit of detail. However, as we sailed towards Turtle Bay in the dark, we did not yet know whether or not there was a 1-2 nm offset (error) to the charts. Our radar proved to very useful that night. Nevertheless, it was not until the morning, when we were safely anchored and could clearly see all of Turtle Bay that we concluded the C-MAP Turtle Bay chart is indeed pretty accurate.  (Radar and charts, however, could not show the many lobster buoys at the entrance to Turtle Bay. We were lucky we made it through these in the dark!)

We did not have Navionics charts back in 2013. However, reviewing Navionics charts now (2015), we see similar accuracy between Navionics and C-Map charting for the Pacific coast of Baja. (In the Sea of Cortez, we have found that Navionics charts are not as up-to-date as C-Map; for example: Altata, Loreto, and, south of the Sea, San Blas.

The guidebooks provide many useful waypoints for anchorages. Although the location of these waypoints are indicated on the guides' chartlets, these chartlets are not usually very detailed (Charlie's Charts' chartlets appear to be handdrawn). So, one cannot be sure of the accuracy or location of these waypoints.

A PARTIAL SOLUTION: Reading other cruisers' blogs (see, for example: SV Totem; SV Ocelot; SV Valhalla; SV Soggy Paws), we came to a (partial) solution to the above chart inaccuracies and uncertainty about waypoints: creating GPS-accurate electronic "charts" from Google Earth (GE). Specifically, we used three excellent programs, all freely available: GE2KAP (now "SAT2CHART") and Google Earth to create the GE-based electronic raster charts (each with .kap extensions), and the OpenCPN charting program to display the charts as well as the guides' waypoints. Although the GE-based raster "charts" do not provide depth sounding and other underwater data, one can clearly see land-based features (buildings, beaches, wharves, etc) and their relationship to the ocean, and usually, one can clearly see shallows, underwater spits, breaking waves, and often reefs. Moreover, entering the guides' waypoints allows one to see exactly where the waypoints are relative to the shore features.  Any offset in other electronic charts can also be determined. As with other electronic charts, one can use OpenCPN with a GPS to plot your vessel's position on the GE-based chart.

Unfortunately, we did not figure the above out until after we rounded Cabo San Lucas and reached the Sea of Cortez. Although we found the GE-based charts sometimes helpful in the Sea, they are not needed as much as there are excellent harbour/anchorage charts for the Sea of Cortez available from Shawn and Heather's Blue Latitude Press cruising guides, electronic waypoints, and electronic charts (also available for mainland Mexico, but not for the Pacific coast of Baja).

AN EXAMPLE: Abreojos, located between Turtle Bay and Bahia Santa Maria on Baja's Pacific coast, provides an excellent example of the utility of the GE-based "charts". The paper and electronic charts for Abreojos lack both detail and accuracy. The images below show what we had available as well as what we could have had if we had been using GE-based charts.

[After leaving Turtle Bay, we headed for Abreojos, with the intent of anchoring for a night. However, when as close as 10 nm away from Abreojos (we could see its main lighthouse), we found ourselves bashing into 10-20 kn SE winds. We figured these winds would blow directly into the exposed anchorage and, given the sketchy charts and numerous surrounding reefs, we changed course and headed directly to Bahia Santa Maria, another night and day away.]
The Yachtman's paper chart for Abreojos

Abreojos chartlet from Rain's "Mexico Boating Guide" Anchorage waypoints were given in the text.

Abreojos chartlet from Charlie's Charts: only the entry waypoint (for avoiding reefs) given.


CM93-2007 electronic chart at maximum resolution. Waypoints from both guidebooks are shown, as well as the location of the lighthouse (from the Mexican "List of Lights")

The CM93 chart shows little detail and, assuming the waypoints are accurate, the electronic chart is clearly inaccurate (the main lighthouse is missing, the light on the hill is no longer in use, and the El Campo anchor waypoint is on land...).
C-MAP electronic chart showing Abreojos (at maximum resolution). Waypoints from both guidebooks are shown, as well as the location of the lighthouse (from the Mexican "List of Lights")


Navionics (2015): provides same (lack of) detail and inaccuracy as C-MAP (2015)

The C-MAP electronic chart provides a little more detail (although with very few depth soundings). Waypoints seem reasonably located. Again, the main lighthouse is missing or inaccurately located. (The lighthouse shown high up on the hill behind the town has long been out of use.)

The Navionics chart is much the same as the C-MAP.


Google-Earth "Charts":
Smaller-scale Google Earth "chart" (created using GE2KAP) overlaid on CM93 chart.

Google Earth "chart" (created using GE2KAP), zoomed in on the "Town" anchorage. Location of Rains' anchor waypoint now accurately shown relative to beach. Shallows and some reefs are also visible,

The town buildings and beach are clearly visible, as is the anchorage waypoint position relative to the beach, breakers, and the lighthouse.

Google Earth "chart" (created using GE2KAP), zoomed in on the "El Campo" anchorage (Rains). Location of anchor waypoint now accurately shown relative to beach. Shallows and some reefs are also visible.

As above, the Abreojos "El Campo en Medio" anchorage east of town is shown clearly on this zoomed-in larger-scale GE-based chart. Shallows (or reefs) are shown fairly close inshore of the anchorage.

We wished we had had these Google-earth based "charts" setup for our sail down the Pacific coast of the Baja peninsula. With the combination of the Rain's and Charlie's Charts guides, C-MAP charts, and the GE-based image charts, we would have felt far more confident navigating closer to shore. We highly recommend cruisers planning their trip down the Baja peninsula prepare GE-based image charts before heading south.

[See update below regarding ESRI ArcGIS satellite images.]


RECOMMENDATIONS:

  • Before leaving Ensenada, try to obtain the new detailed large-scale Mexican charts from SEMAR (there is a chart sales office in Ensenada*). NOTE: These charts are now available online digitally from O-CHARTS (see this March 2022 blog post). The reasonably up-to-date smaller-scale SEMAR charts -- all corrected to WGS84 datum -- would also be useful. (This may be easier said than done; we didn't learn about SEMAR until after leaving Ensenada. Ability to speak Spanish likely a huge help. Our attempt to obtain these electronic charts in La Paz was not successful, though we did find detailed paper charts.) Charts are the same price for paper or electronic (raster) formats. If you are bypassing Ensenada, you might consider a land trip from San Diego to Ensenada (bus travel is very easy). (But it would be a shame to miss Ensenada as it is a great cruising stop: easiest check-in to Mexico, excellent marinas, excellent provisioning (Soriana, Costco, etc), the best fish/shrimp tacos in Mexico, and a great bar (Hussong's).) 
  • If you are using C-MAP (or Navionics -- we've found they have similar issues; for example, see above, or this Latitude38 article on Navionics) chart cards, ensure they are up-to-date!
  • Obtain up-to-date cruising guides for Baja California. Enter their relevant waypoints into electronic form so you can transfer these to your chartplotter and your navigation computer/tablet charting program (easily done using GPSUtility) . (Also, you might be able to obtain trustworthy waypoints from other cruisers experienced with Baja.)
  • Using GE2KAP (now called SAT2CHART) and Google Earth (better, use BING or ESRI ArcGIS images), create GE-image charts for each Pacific-coast Baja anchorage you expect to stop at (and consider alternate anchorages). In many cases, you will want a small-scale zoomed-out image chart as well as a large-scale, zoomed-in/detailed image chart. (Alternatively, using the "tile" function in GE2KAP -- or the "Stitch" function in SASPlanet -- one can make one chart with very high zooms.)
  • Load these into your navigation software, such as OpenCPN (these GE-image-charts will not likely be usable on your boat's dedicated chartplotter). UPDATE: Make image-charts from more-accurate ESRI satellite images.
  • Use multiple sources of information while navigating down the Baja Peninsula; learn to use your radar.


*LOCATION OF CHART SALES IN ENSENADA: Estación de Investigación Oceanográfica de Ensenada, B.C.,  Boulevard Costero y Agustín Sangines (A & B), Ensenada, B.C. 22800 Tel. +52  (646) 172-5743   Email: oceanografia_eda@hotmail.com 


UPDATE:

Using ESRI ArcGIS satellite images, I am able to pinpoint position of the Rocas Ballena and La Rechinadora rocks, dangerous rocks just NW of Punta Abreojos. I have made waypoints for these rocks.

The ArcGIS images are more-detailed than the Google Earth images. In the pictures below, I have plotted the various waypoints on an ArcGIS image (a little blurry in this blog image), on a CM93-2012 chart (which has much better detail than the older CM93 above, BUT chart datum is clearly off), as well as a zoom-in on the anchorages.


If you are interested in obtaining a zip file containing: (i) a GPX waypoint filefor Abreojos, and (ii) and two image "charts" for Abreojos (one zoomed in and the other smaller scale/overview),Click here to download.   NOTE, the information in these files comes with no warranty and should not be used for real-time navigation. Use at your own risk!

Monday, 31 August 2015

Boat Gear Part II: What we didn't find so "useful" in Mexico


Below are some items we purchased specifically for our trip to Mexico, but found they were not so useful (and in at least one case, useless).


Honda Generator EU2000i:

We only used the generator twice in our two seasons in Mexico (and never on the San Francisco-San Diego legs). Our solar panels gave us the charging we needed.

The first time we used the Honda generator was in Turtle Bay, on the way down the Pacific Coast of Baja when we had sailed most of the way from Ensenada (3 days/2 nights): it was cloudy, and we used the autopilot too much (rather than Hydrovane). Then it rained all day in Turtle Bay. The Honda Generator helped bring the batteries up without us having to run the engine. (As it turned out, we stayed 4 nights in Turtle Bay, and the sun came out for the final 2.5 days, allowing the solar panels to fully charge our batteries.)

The second time we used the Honda generator was much later in Puerto Escondido. We decided to have a little luxury and have hot showers onboard (the marina was a long dinghy ride away; and besides, its showers were not working). So actually no real need to use the generator.

Perhaps if we had had a watermaker and had anchored out more often, we might have needed to use the generator. Nevertheless, even after anchored out for several days and before moving to a new anchorage, we didn't need the generator. (Note: another reason the generator wasn't needed is that one has to motor a lot in Mexico -- so lots of charging and hot water.)


Yachtsman Mexico to Panama Chart Book (7th  Ed):


Almost useless for us, this "updated" chartbook, based on old DMA charts, contained very out-dated charts, with no updates from Mexican charts created over the past 20 years. [This book's charts don't even show the marina basin for Cabo San Lucas (first dredged in 1974-1975), nor the dredged Sabalo estuary and its many marinas (e.g., El Cid Marina and Marina Mazatlan) just north of Mazatlan's Zona Dorada (Gold Zone).] The charts were never better than C-MAP (or Navionics), and usually much worse.

Note: these charts are not "official" charts, thus they have the same legal status (though not utility) as C-MAP or Navionics.

At US$90, this chart book was, for us, a waste of money. We do not recommend you buy it.


Blue Performance Wind Catcher (wind scoop): 

We like wind scoops, just not this one. It has a bug screen on it, which effectively cuts air circulation to perhaps one-third (I suppose one could cut out the bug screen -- would be nice if screen could be removable). On the positive side, the Blue Performance Wind Catcher is multidirectional (i.e., does not need to be moved when the wind direction changes while at a dock). 

We had better airflow using simpler wind scoops such as the Davis wind scoop (or even a tarp placed at an angle).

Wind scoops are problematic, however, when there are bugs outside (not uncommon in the Sea of Cortez) -- hence we purchased the B-P Wind Catcher with its screens. Too bad this significantly cut down the air circulation.


Collapsible/Folding Hand Cart:
We only used our "Magna Cart" once in two years (to get propane in Ensenada). Not very strong and problematic on the rough sidewalks/roads of Mexico.


Charlie's Charts & Rain's Mexico Boating Guide cruising guides to Mexico:

Inclusion of these cruising guides on this "less useful" list is a little problematic, as we definitely used (and needed) these two guides for the Pacific coast of Baja (there were no other reasonably up-to-date guides available that cover this coast). These guides provide waypoints and anchorage coordinates, as well as chartlets. Each to their own, but in our opinion their chartlets did not give us confidence when navigating near the coast. 


Once we rounded Cabo San Lucas, and started using the Blue Latitude Press cruising guides by Shawn and Heather, we rarely found Charlie's Charts or Rain's Mexico Boating Guide helpful. Eventually, we stopped using them. So, we found these latter guides "less useful" specifically for the Sea of Cortez and the mainland coast of Mexico. 


Baja California Cruising Map 

Available online and from some marine stores in California, at first glance we thought this map and its GPS waypoints would be useful for us. It wasn't/they weren't. Although it provides GPS waypoints for anchorages, the scale of the map is much too small (i.e., no fine detail) to indicate where in an anchorage the waypoint is located, even in an approximate way (no features are visible). Given that many areas are already poorly charted, having a waypoint with no additional information does not inspire confidence. (The lat/long coordinates for each waypoint are listen in large table on the map. It would have been nice for the authors to provide a way to purchase and download an electronic version of these waypoints.)

We only used this map to give an idea of where a location was in the overall picture of the Baja California peninsula. And only occasionally. Nice as a picture on the wall but not so helpful navigating.

The above is not a comment on the accuracy (or inaccuracy) of the waypoints -- we just didn't use them. The map does provide passage waypoints which might be helpful for those considering the Baja Bash (i.e., going north).